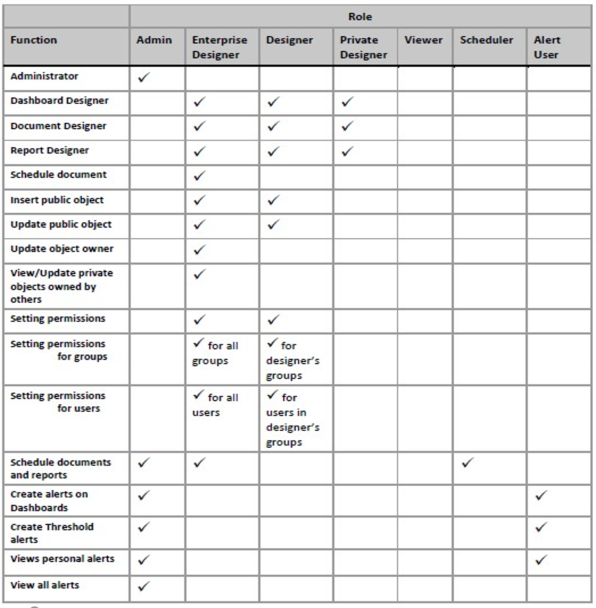
USERS RIGHTS IN XTRACTION
Summary Table of Rights in Xtraction
CREATION OF DASHBOARDS
Steps
4 Steps for Creating a Dashboard

- Select view
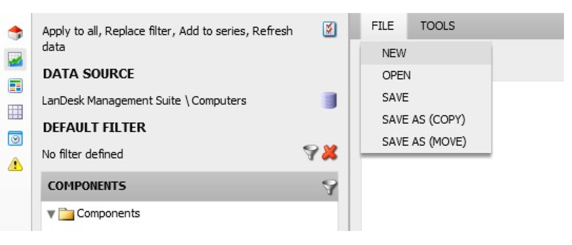
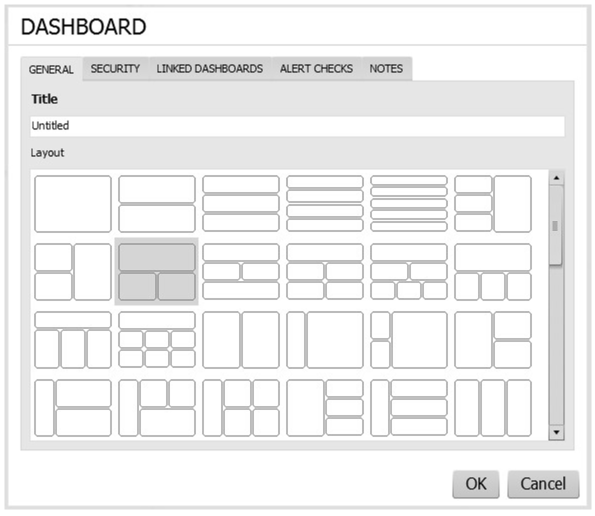
- Dashboard creation process
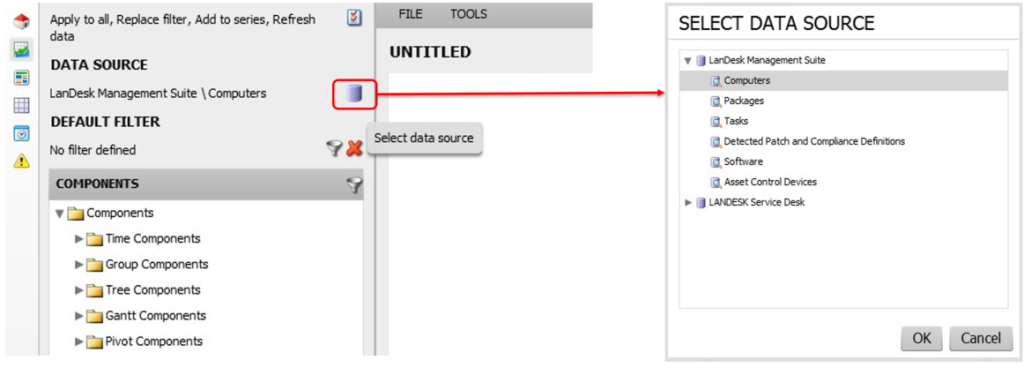
- Select Database source
- Drag and drop components

- Affichage des résultats sur une ou plusieurs fenêtres.
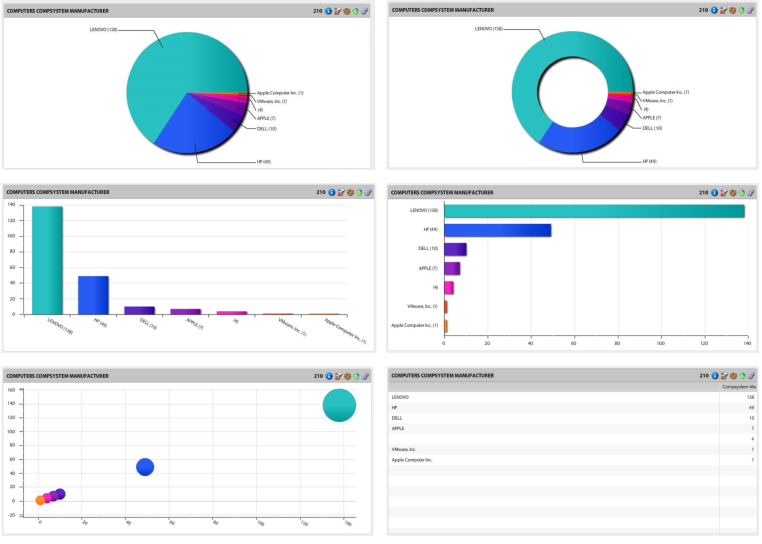
TYPE COMPONENTS
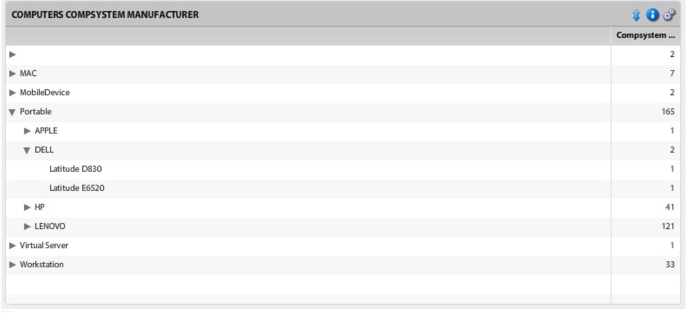
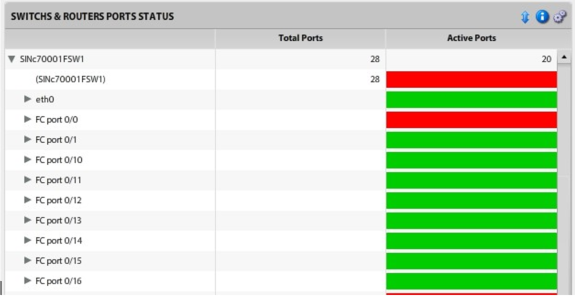
TREE COMPONENTS

Display of Data in a Hierarchical Structure
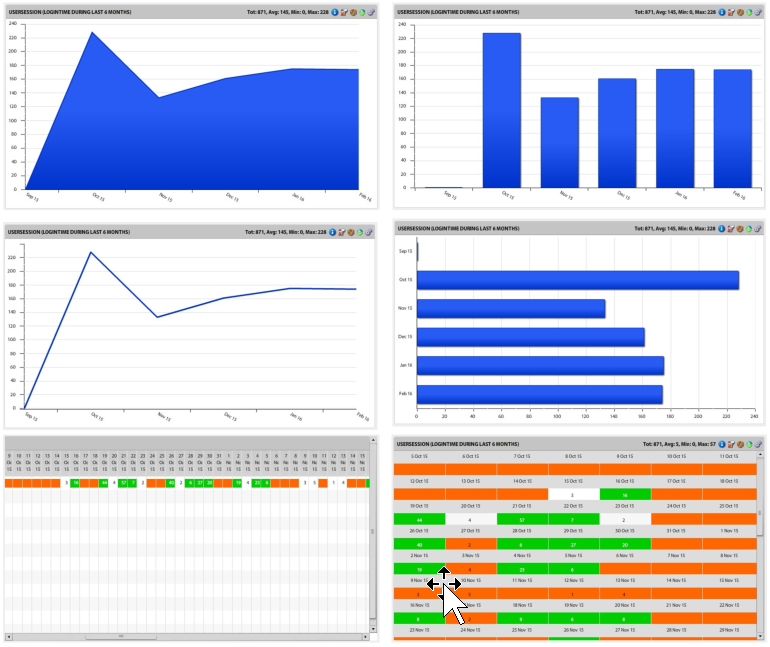
TIME COMPONENTS

Representation of Data by Hours, Days, Weeks, Months, etc.
PIVOT COMPONENTS
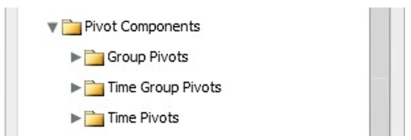
Type pivot
- Group
- Time
- Time Group

GANTT COMPONENTS

Display of Data with Gantt Charts

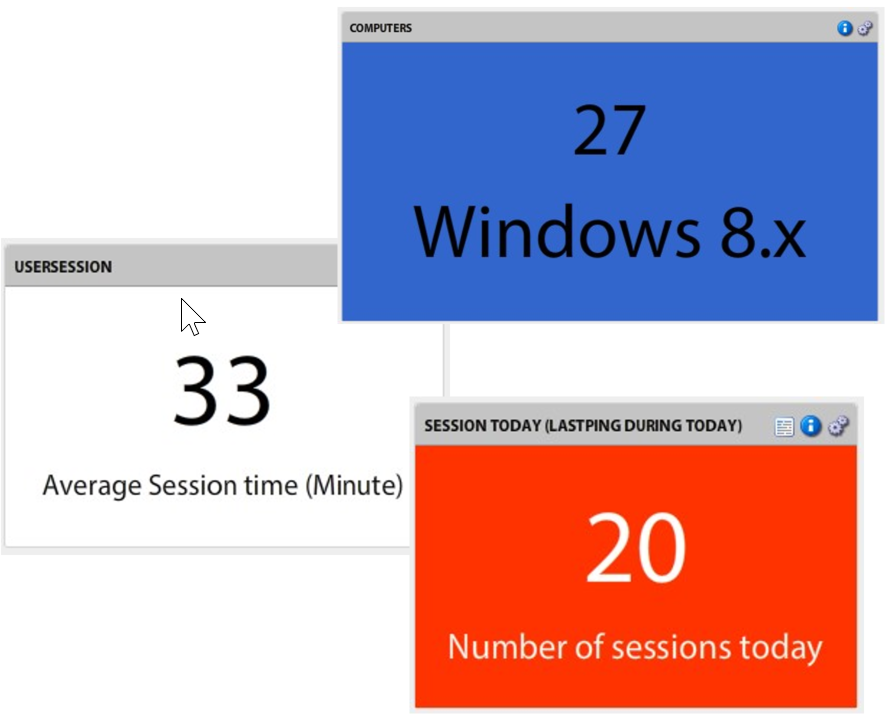
SCORECARD COMPONENTS

view by
- Count
- Sum
- AVG
- Min
- Max
RECORD LIST COMPONENTS

Display of Raw Data
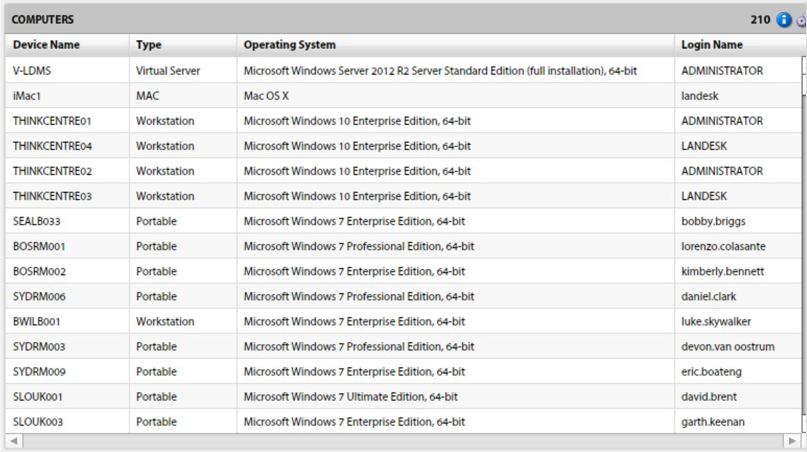
TEXT COMPONENTS

Display of a Text or a Web Link

IMAGE COMPONENTS

The image can be
- Uploaded to the xtraction server
- Point to a file server
- Point to a web link

OPTIONS SUR LES COMPONENTS
CONPONENT TOOLBAR


Display / Hide Options

Export png, xls, pdf, html, doc, ppt

Allows Changing the Type of Component

Remove Temporary Filters

component property
COMPONENT PROPERTIES
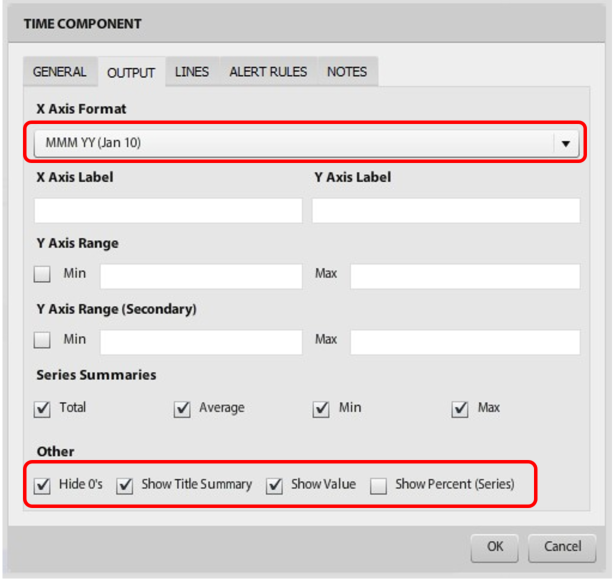
X Axis Format => Affects the Period of the Chart
Other => Show / Hide Information”
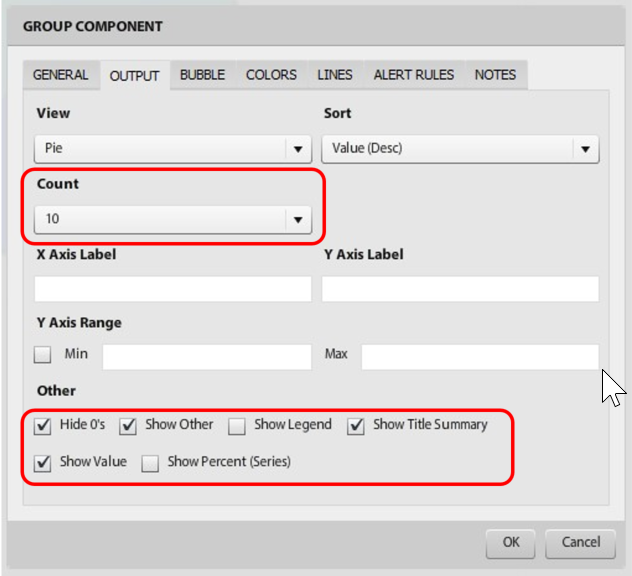
Count => Limit the Number of Items Displayed
Other => Show / Hide Information on the Chart and in the Title
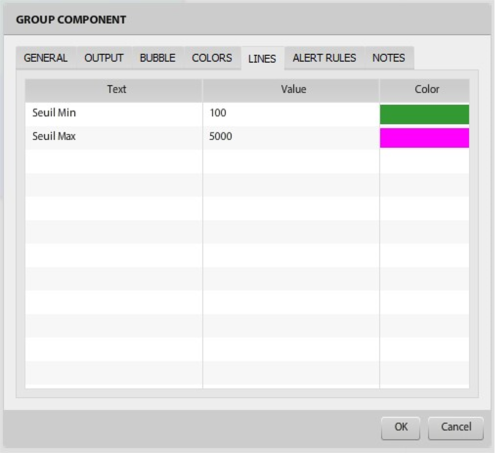

Change the Color of Attributes
FILTRES
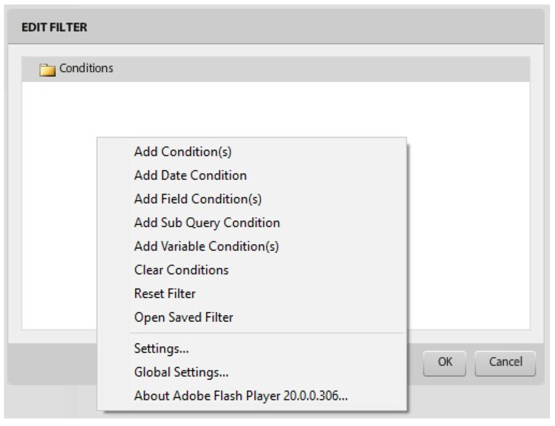
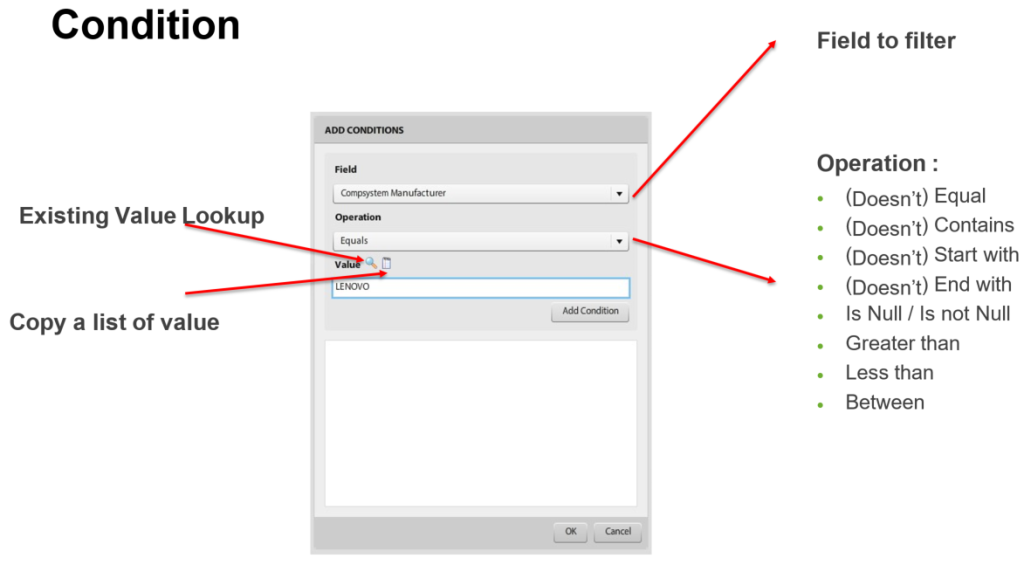
CONDITION
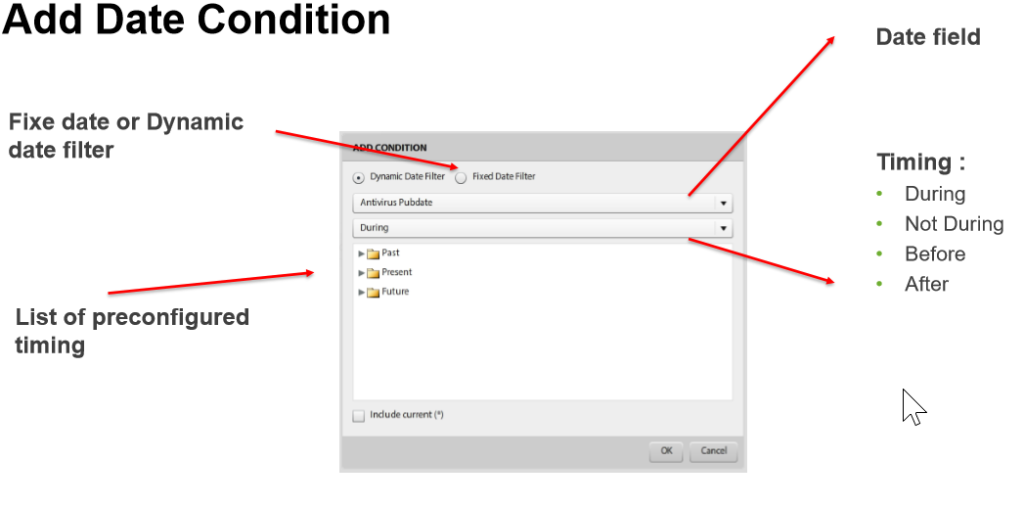
DATE CONDITION
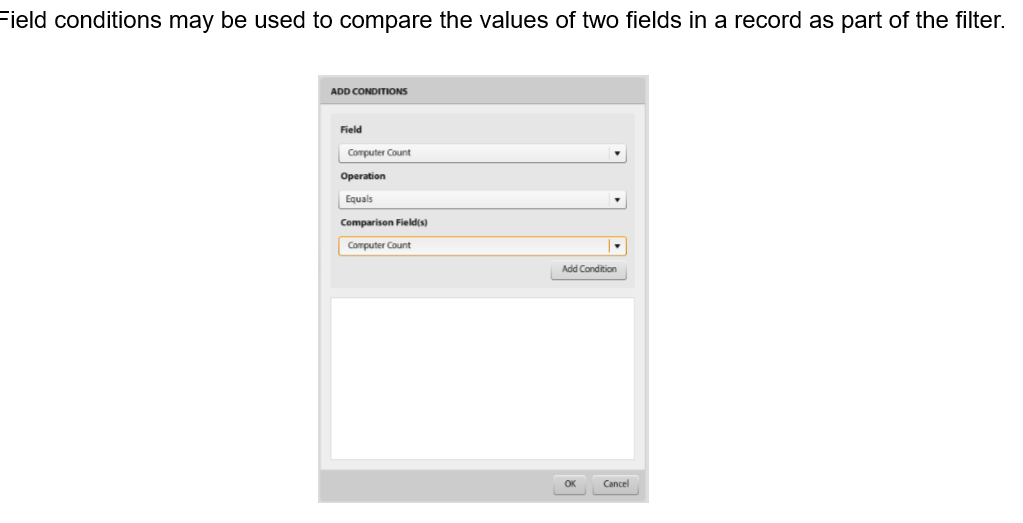
FIELD CONDITION
Refresh DASHBOARD
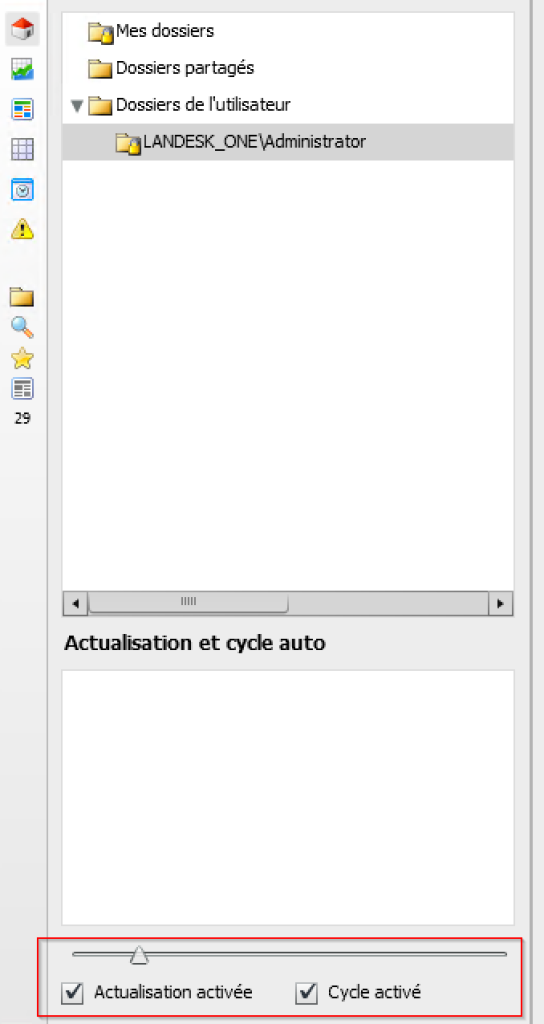
Enable Automatic Dashboard Refresh
