Use Ivanti Xtraction to Create Dashboards
Ivanti Xtraction Create – This guide explains how to use Ivanti Xtraction to create dashboards, manage user rights, select data sources, configure dashboard components, apply filters, export results, and refresh dashboard data.
Useful external reference: Ivanti resources.
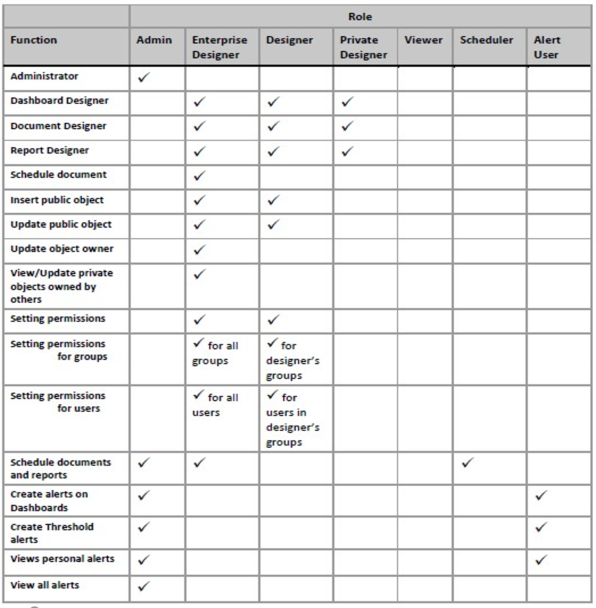
User Rights in Xtraction
Ivanti Xtraction Create – Summary Table of Rights in Xtraction
Useful external reference: Ivanti resources.
CREATION OF DASHBOARDS
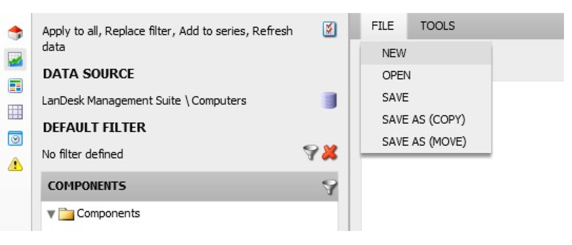
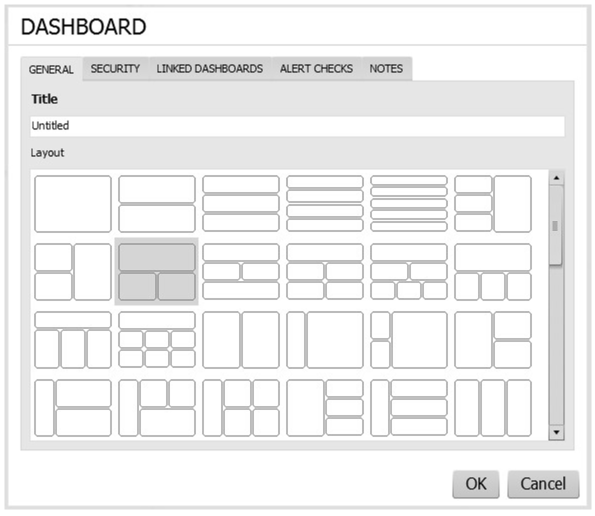
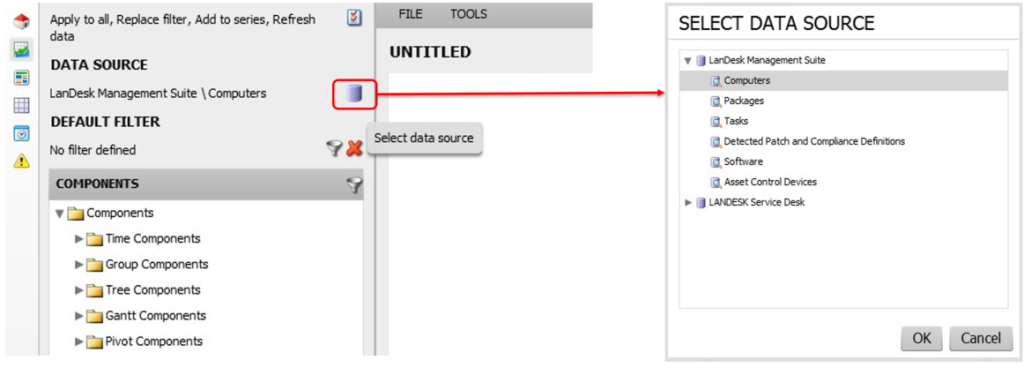
Steps
Ivanti Xtraction Create – 4 Steps for Creating a Dashboard
Useful external reference: Ivanti resources.

- Select view
- Dashboard creation process
- Select Database source
- Drag and drop components

- Affichage des résultats sur une ou plusieurs fenêtres.
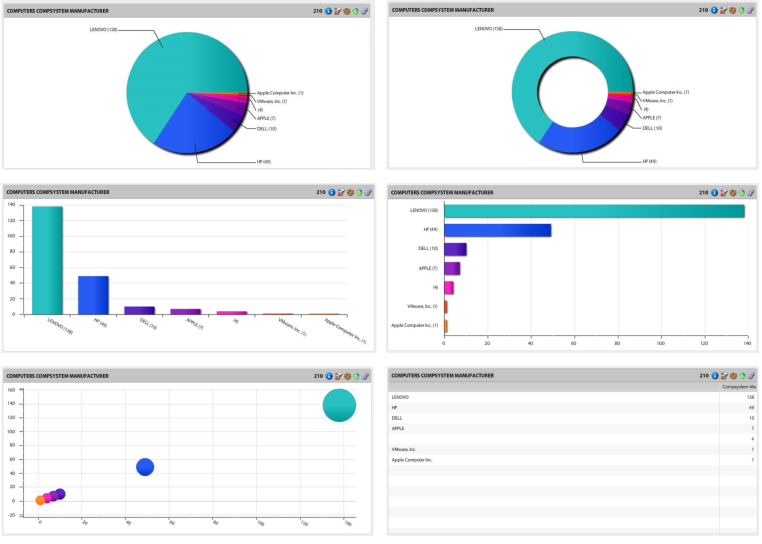
TYPE COMPONENTS
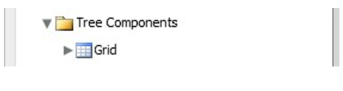
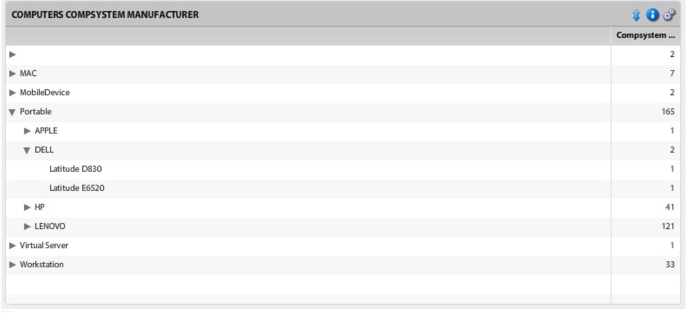
TREE COMPONENTS
Ivanti Xtraction Create – Display of Data in a Hierarchical Structure
Useful external reference: Ivanti resources.
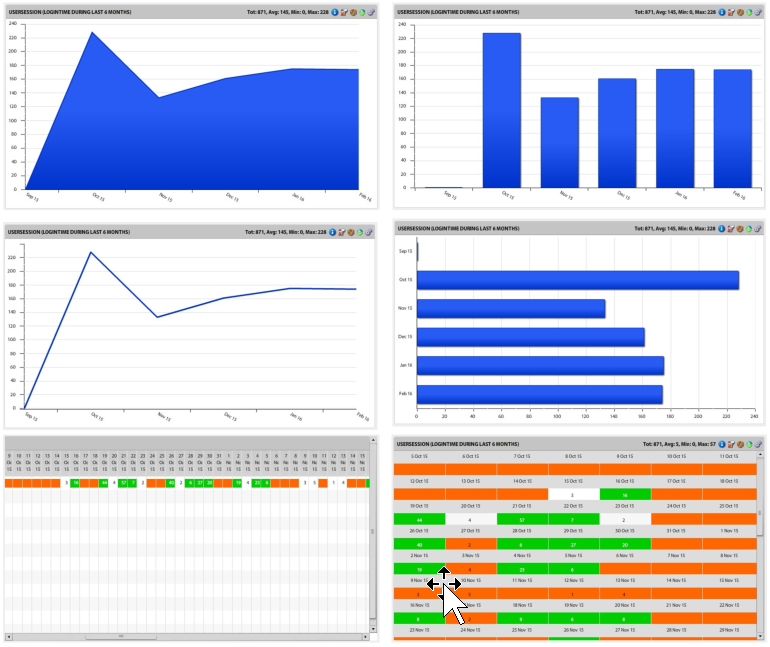
TIME COMPONENTS

Ivanti Xtraction Create – Representation of Data by Hours, Days, Weeks, Months, etc.
Useful external reference: Ivanti resources.
PIVOT COMPONENTS
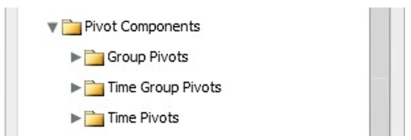
Ivanti Xtraction Create – Type pivot
Useful external reference: Ivanti resources.
- Group
- Time
- Time Group

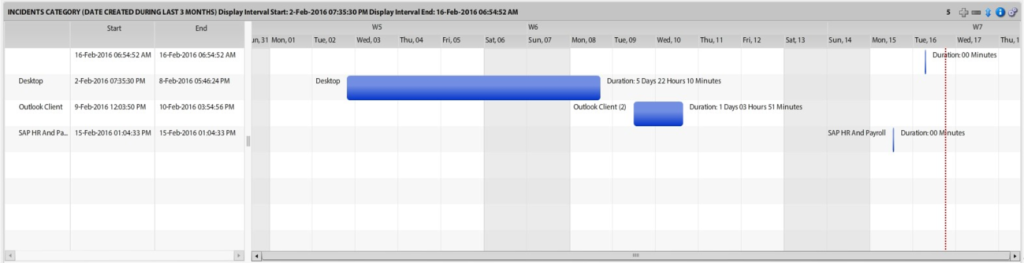
GANTT COMPONENTS

Ivanti Xtraction Create – Display of Data with Gantt Charts
Useful external reference: Ivanti resources.
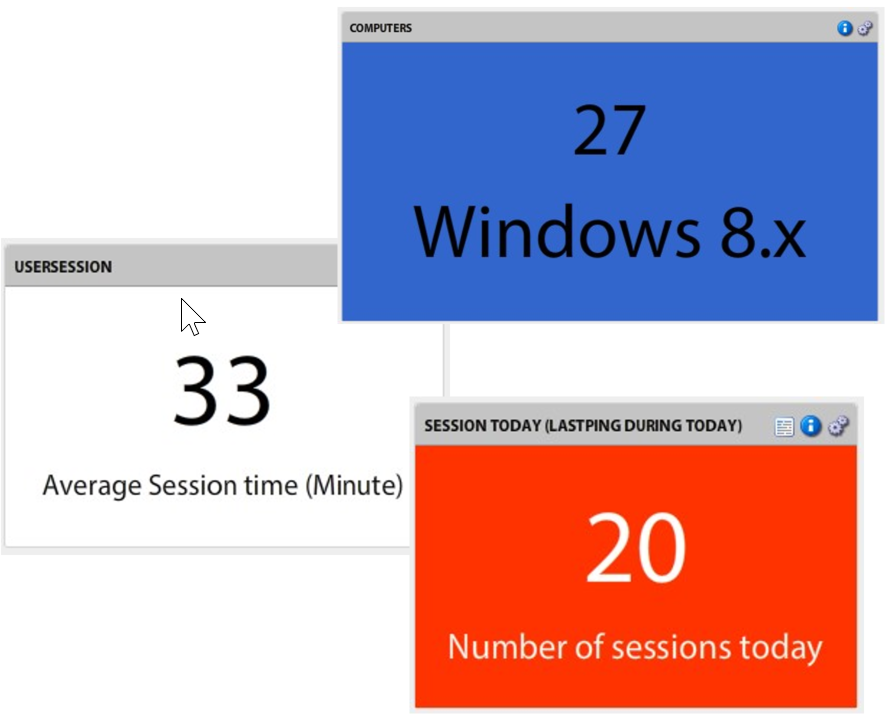
SCORECARD COMPONENTS

Ivanti Xtraction Create – view by
Useful external reference: Ivanti resources.
- Count
- Sum
- AVG
- Min
- Max
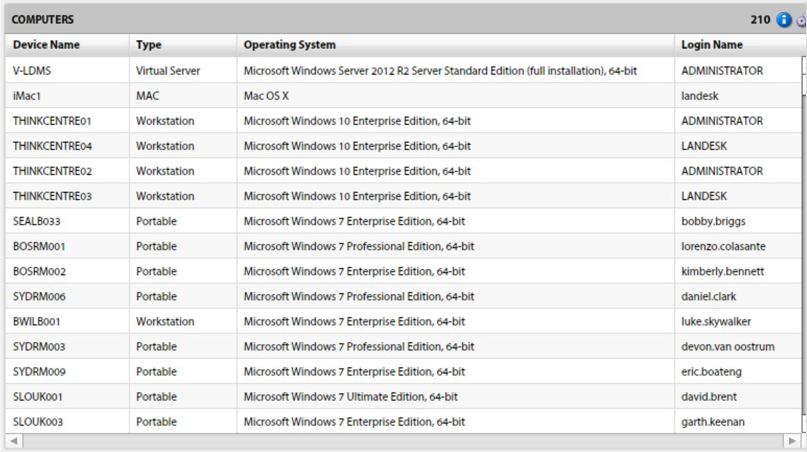
RECORD LIST COMPONENTS

Ivanti Xtraction Create – Display of Raw Data
Useful external reference: Ivanti resources.
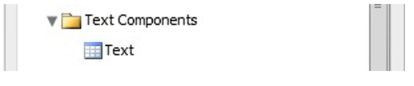
TEXT COMPONENTS
Ivanti Xtraction Create – Display of a Text or a Web Link
Useful external reference: Ivanti resources.
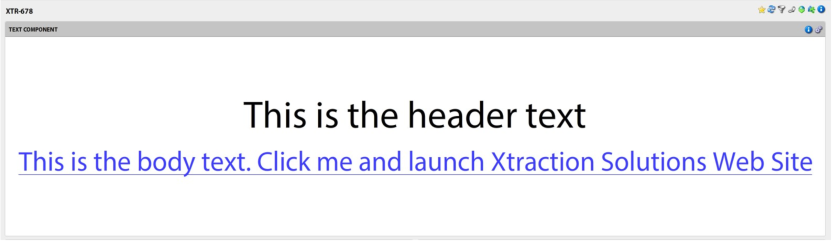
IMAGE COMPONENTS

Ivanti Xtraction Create – The image can be
Useful external reference: Ivanti resources.
- Uploaded to the xtraction server
- Point to a file server
- Point to a web link

OPTIONS SUR LES COMPONENTS
CONPONENT TOOLBAR

Ivanti Xtraction Create – Display / Hide Options
Useful external reference: Ivanti resources.

Ivanti Xtraction Create – Export png, xls, pdf, html, doc, ppt
Useful external reference: Ivanti resources.

Ivanti Xtraction Create – Allows Changing the Type of Component
Useful external reference: Ivanti resources.

Ivanti Xtraction Create – Remove Temporary Filters
Useful external reference: Ivanti resources.

Ivanti Xtraction Create – component property
Useful external reference: Ivanti resources.
COMPONENT PROPERTIES
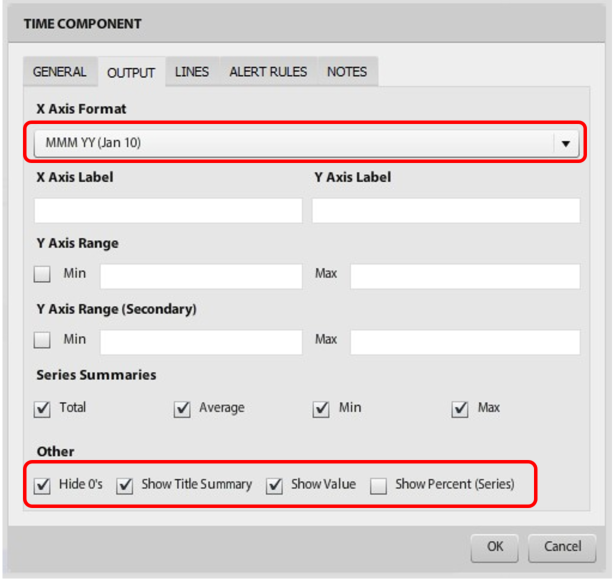
Ivanti Xtraction Create – X Axis Format => Affects the Period of the Chart
Useful external reference: Ivanti resources.
Ivanti Xtraction Create – Other => Show / Hide Information”
Useful external reference: Ivanti resources.
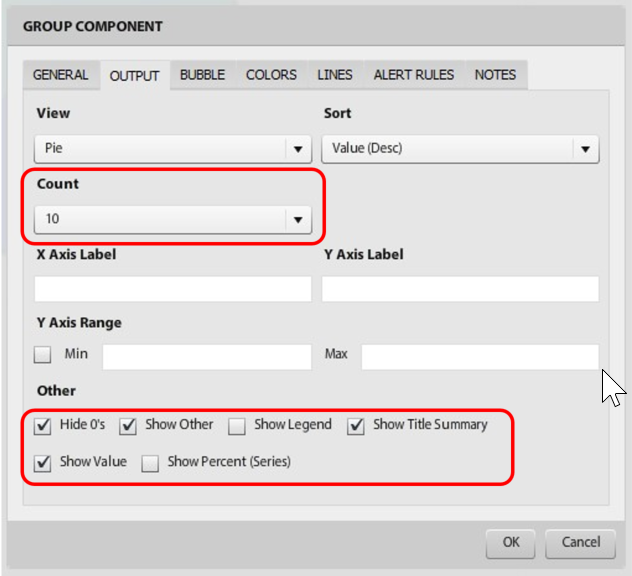
Ivanti Xtraction Create – Count => Limit the Number of Items Displayed
Useful external reference: Ivanti resources.
Ivanti Xtraction Create – Other => Show / Hide Information on the Chart and in the Title
Useful external reference: Ivanti resources.
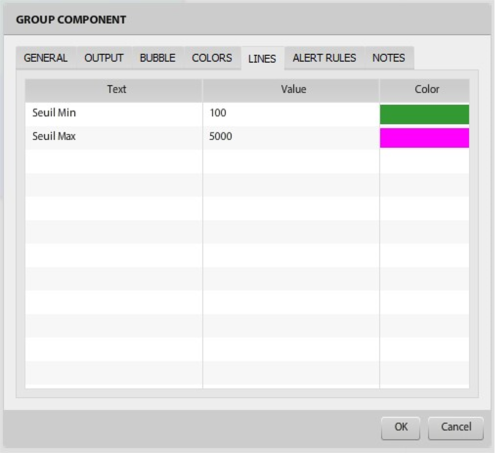

Ivanti Xtraction Create – Change the Color of Attributes
Useful external reference: Ivanti resources.
FILTRES
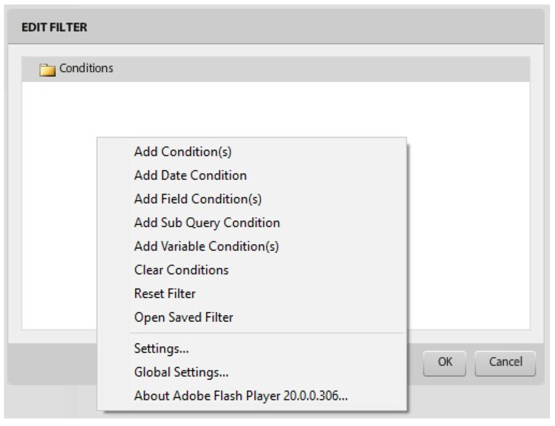
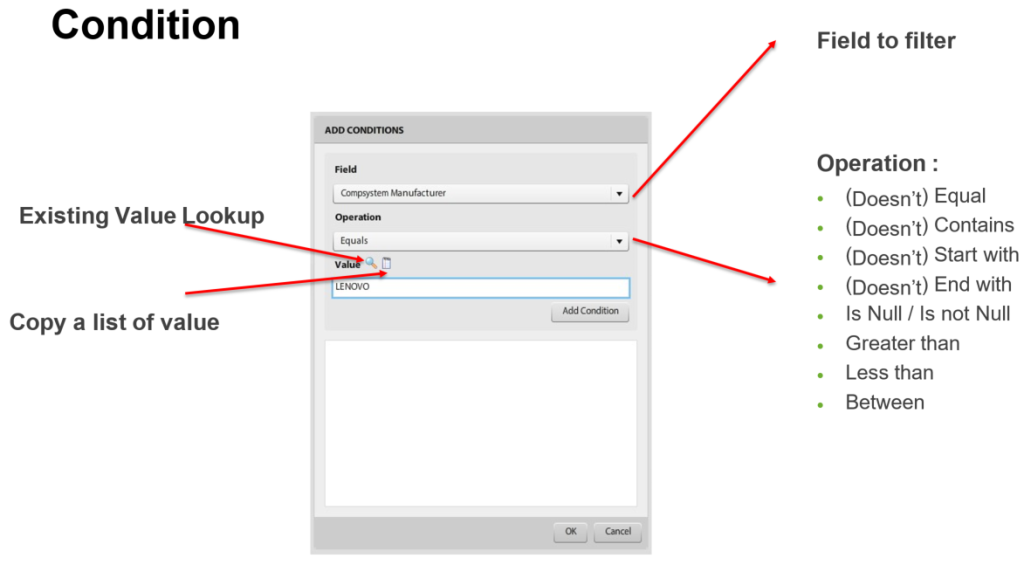
CONDITION
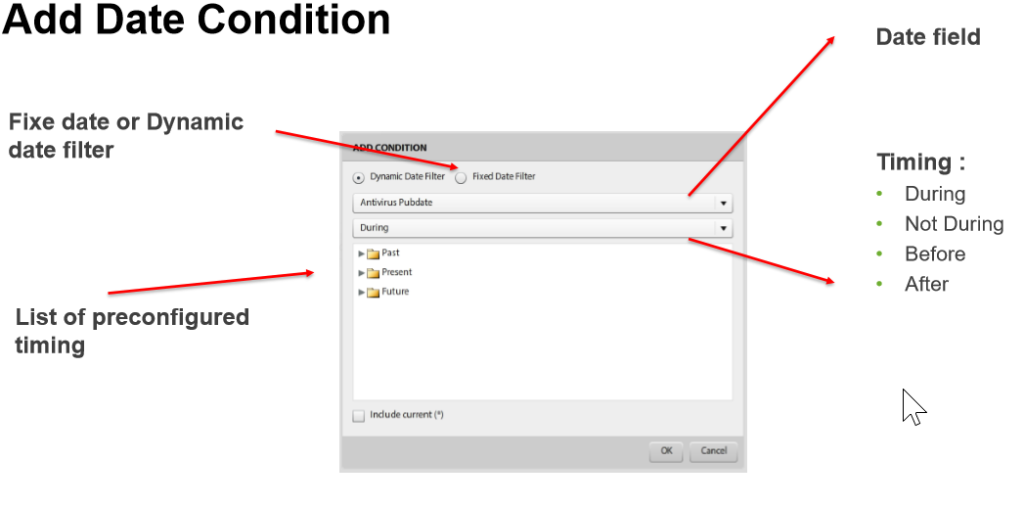
DATE CONDITION
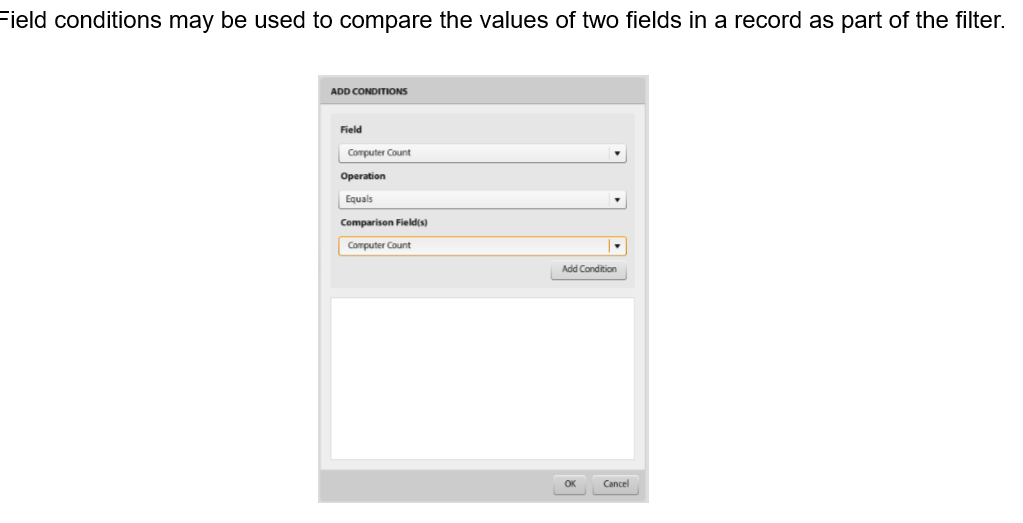
FIELD CONDITION
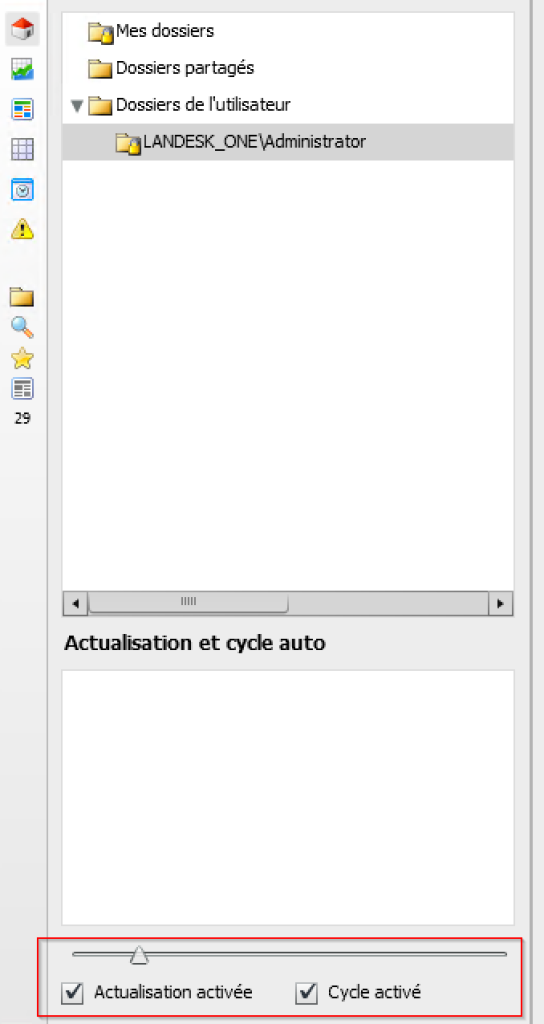
Refresh DASHBOARD
Ivanti Xtraction Create – Enable Automatic Dashboard Refresh
Useful external reference: Ivanti resources.
Ivanti Xtraction Create –
Useful external reference: Ivanti resources.