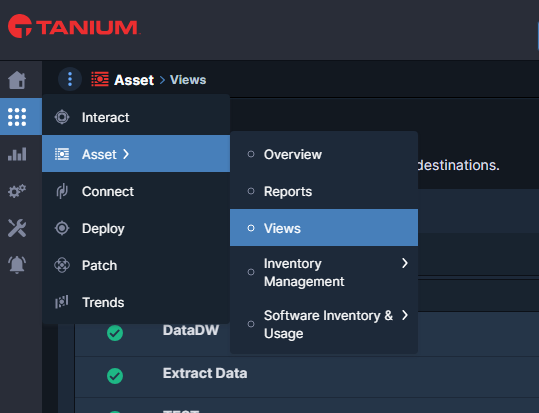
How to Create a View
- Navigate to Assets and select Views.
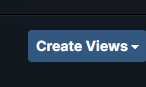
- Click on Create a New View.
- Add columns to your custom view.
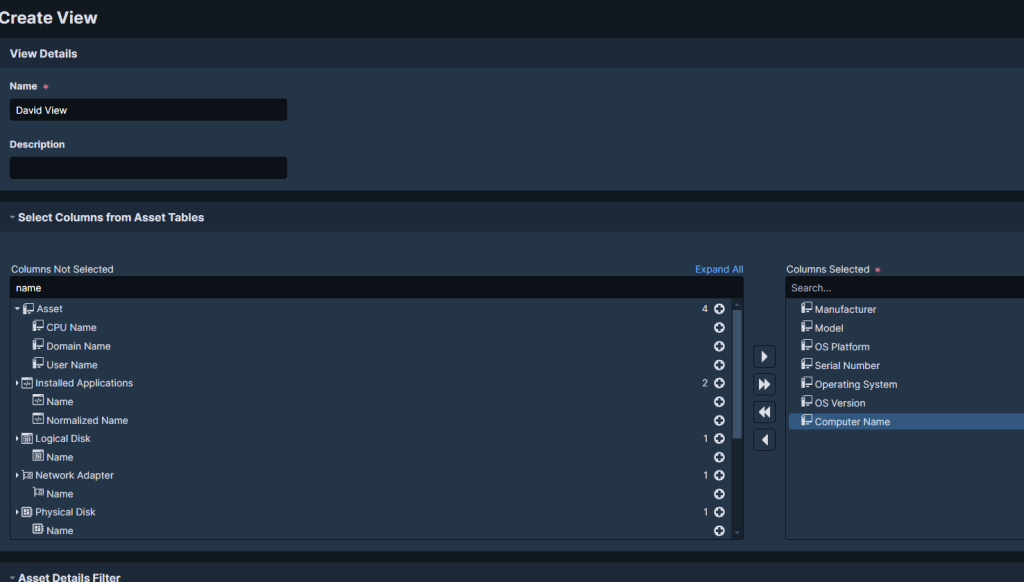
- Click Submit to save your view.
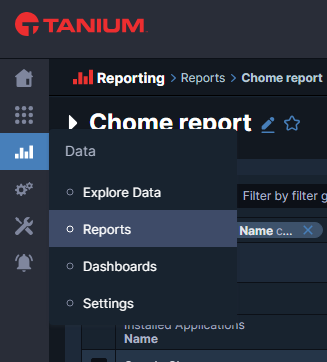
How to Create a Report
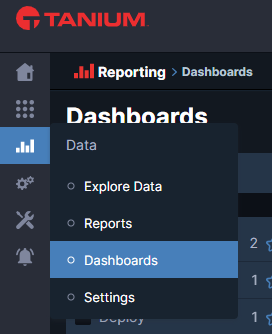
- Under Data, select Reports.
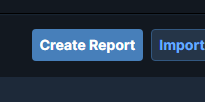
- Click Create Report.
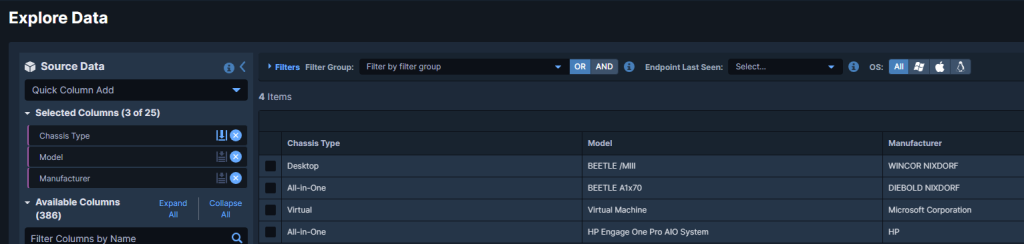
- Select the columns you want to include.
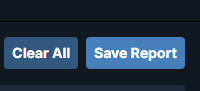
- Click Save Report, enter a name for your report, and save.
How to Create a Dashboard
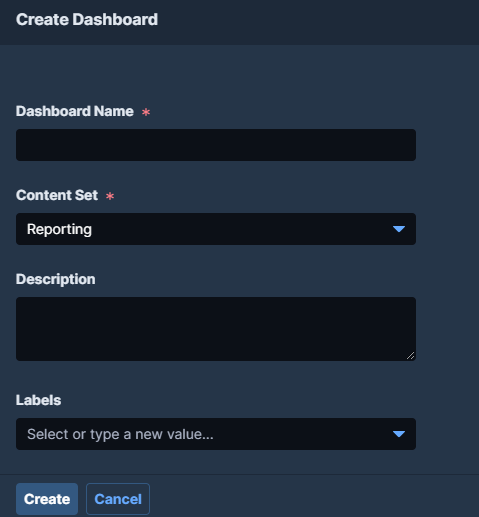
- Under Data, select Dashboards.
- Enter the dashboard name and click Create.
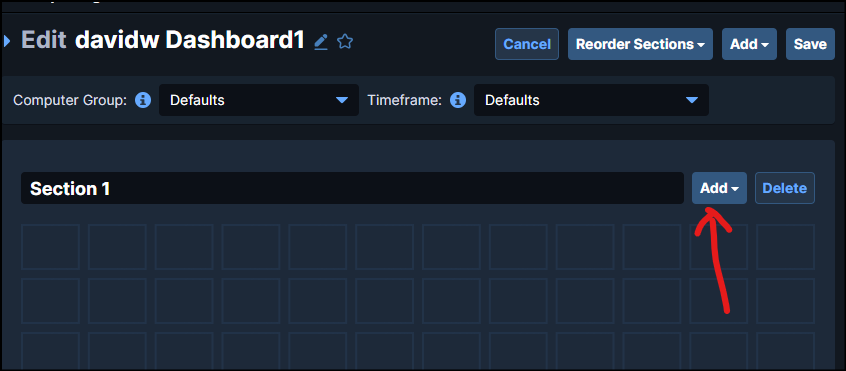
- Click Add to add a new panel.
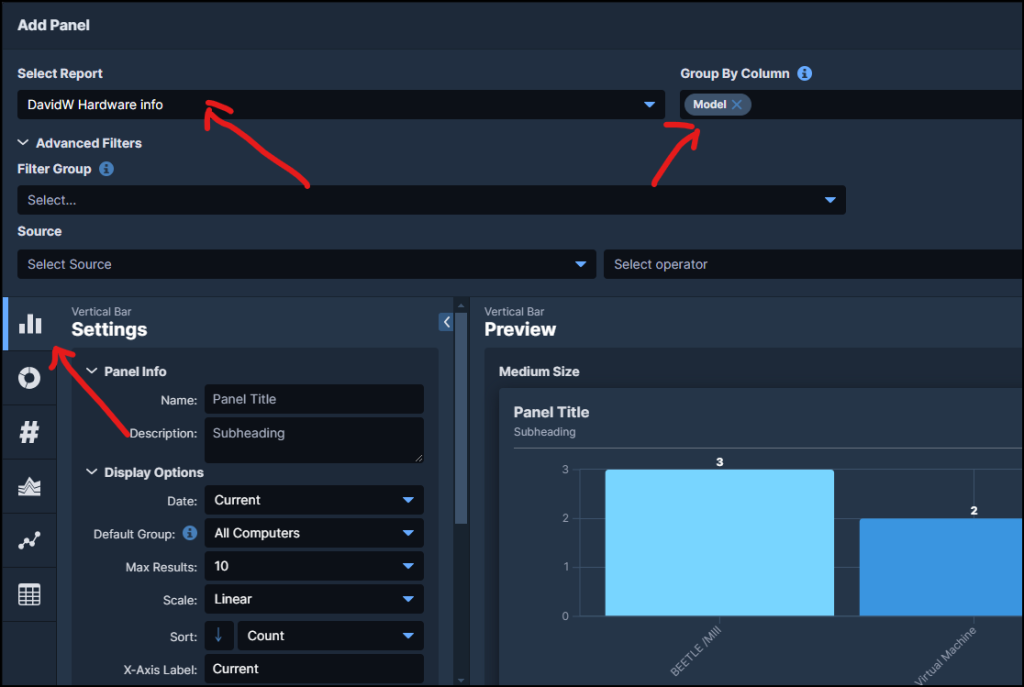
- Select the report, column, and graph type.
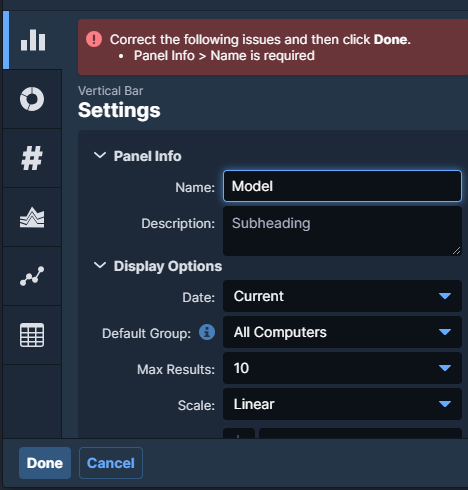
- Enter the panel name and click Done.
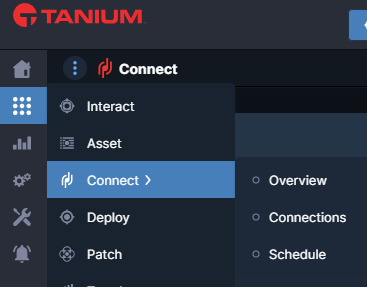
How to Export a Dashboard to an S3 Bucket
- From the Connect menu, select Connections.
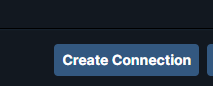
- Click Create Connection.
- Enter a name for the connection.
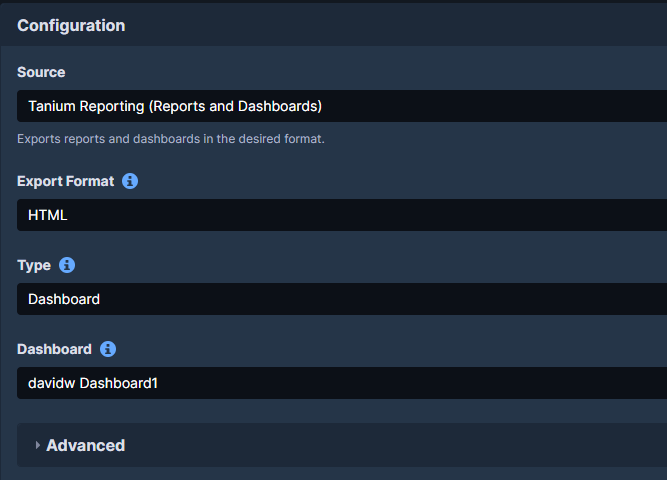
- Select “Tanium Reporting (Reports and Dashboards)” as the source.
- Select the dashboard name you wish to export.
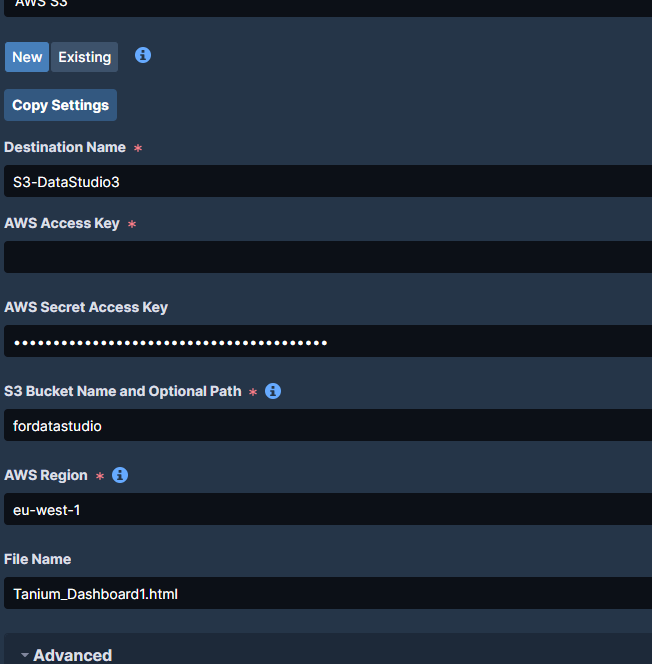
- Input AWS S3 details and enter the filename with extension.
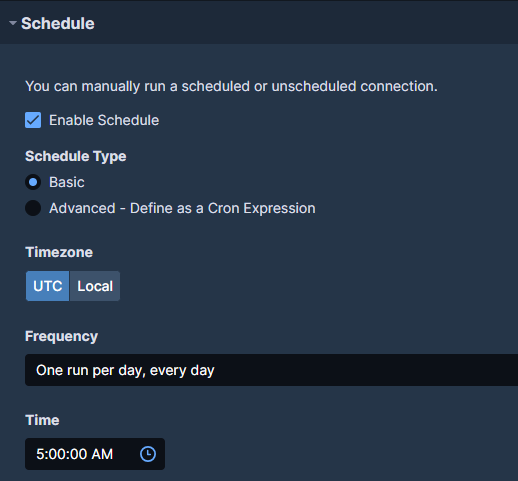
- Optionally, schedule this export.
How to Export Source Data to an S3 Bucket
- From the Connect menu, select Connections.
- Click Create Connection.
- Enter a name for the connection.
- Select “Tanium Reporting (source data)” as the source.
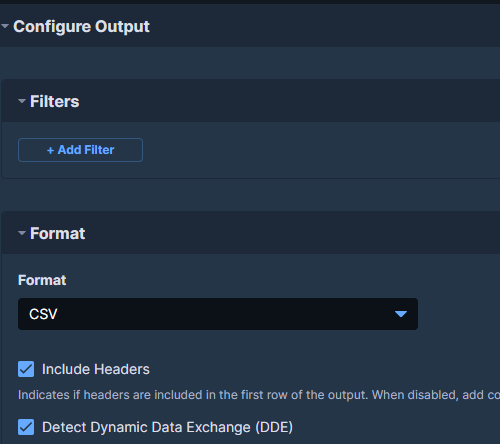
- Select the report and specify the output format (e.g., CSV).
- Enter AWS S3 details and the filename with extension.
- Optionally, add a schedule for this export.


0 Comments